Tech
Haider Anfal
Sep 17, 2025
Why More Telemetry ≠ Better Insights: How we Designed Scalable Observability at Wolt

TLDR: As Wolt’s systems scaled, so did our telemetry, and with it, operational and financial complexity. We discovered that more data doesn’t always mean better insights, especially when metric cardinality gets out of hand.
This blog covers how we:
Built TRIM, a lightweight policy engine for telemetry resource ingestion
Improved custom metrics indexing efficiency by more than 70%
Reduced our custom metrics by 39%, without compromising developer experience and quality of observability
The result was a leaner, smarter, and more cost-effective approach to observability. Read on to see how we’re designing scalable observability and what’s next for our platform.
Wolt is a technology company on a mission to bring joy, simplicity, and earnings to neighborhoods around the world. Every day, our platform connects people across 30+ countries; customers ordering food and other goods; merchants managing their storefronts; and couriers delivering with speed and precision.
Behind the scenes, this experience is supported by a distributed system of hundreds of microservices, handling everything from order placements, payment processing, to real-time delivery tracking. Each microservice is owned by a small, autonomous engineering team empowered to build, deploy, and scale independently. This autonomy fuels innovation and speed, but it also introduces complexity, especially when it comes to observability.
How do we ensure that every team can reliably make sense of, monitor, and operate their services at scale in a fast-moving environment? That’s the role of our Observability team.
The Observability Unification Journey
The Observability team
As part of Wolt’s Core Platform Group, we build and maintain the observability platform that gives teams the visibility and confidence to operate their services. We provide telemetry as a service: metrics, logs, traces, complete with tooling and abstractions to help engineers understand the state of their systems, debug issues quickly, and deliver resilient software in a highly dynamic environment.
Our goal is to make observability reliable, actionable, and cost-efficient, so teams can focus on what they do best: building great products.
Before: A fragmented telemetry ecosystem
A few years ago, Wolt’s observability stack had grown organically. Different teams had implemented their own tools and workflows to meet immediate needs. As a result, we ended up with a patchwork of systems: separate platforms for logs, traces, and metrics, each with its own quirks and maintenance burdens.
This fragmentation led to growing pains. Engineers were context-switching between dashboards and tools to piece together a single incident timeline. Operational overhead grew as we juggled maintenance of disparate platforms. And technical debt started to outweigh the benefits of speed.
It was clear we needed a unified, scalable approach.
Unification: Choosing Datadog as a central platform
This initiative marked the establishment of a dedicated Observability team. One of our first goals: reduce complexity in our telemetry ecosystem. To address these challenges, we made the decision to consolidate our observability tooling into a single platform: Datadog. While Datadog was already being used for application performance monitoring (APM) and tracing, we expanded its role to include all logging and custom metric use cases.
This unification wasn’t just about simplifying tooling, it was about improving the developer experience. With everything in one place, engineers could debug incidents faster and work more efficiently.
Key benefits we observed early on:
A unified observability experience that reduced developer cognitive load
Significant reductions in operational toil and platform maintenance
Faster mean time to detection (MTTD) and mean time to recovery (MTTR)
Of course, this decision came with trade-offs. Unification introduced concerns about cost, especially for larger SKUs like metrics and logs. We expected some growth in usage, but what we saw next far exceeded our projections and underscored just how challenging this space can be at scale.
What is Metric Cardinality and Why it Matters
Once teams began shipping their logs and custom metrics into Datadog, we noticed something concerning: our custom metrics usage started to spike dramatically.
At the root of this was something commonly known as metric cardinality. Metric cardinality is the number of distinct time series a metric generates when you factor in all the possible combinations of its tags or labels. For example, tracking an HTTP request count with no tags produces just a single time series. But if you add tags like user_id, route, and container_id, every unique combination of those values becomes its own series — quickly multiplying into thousands or even millions.
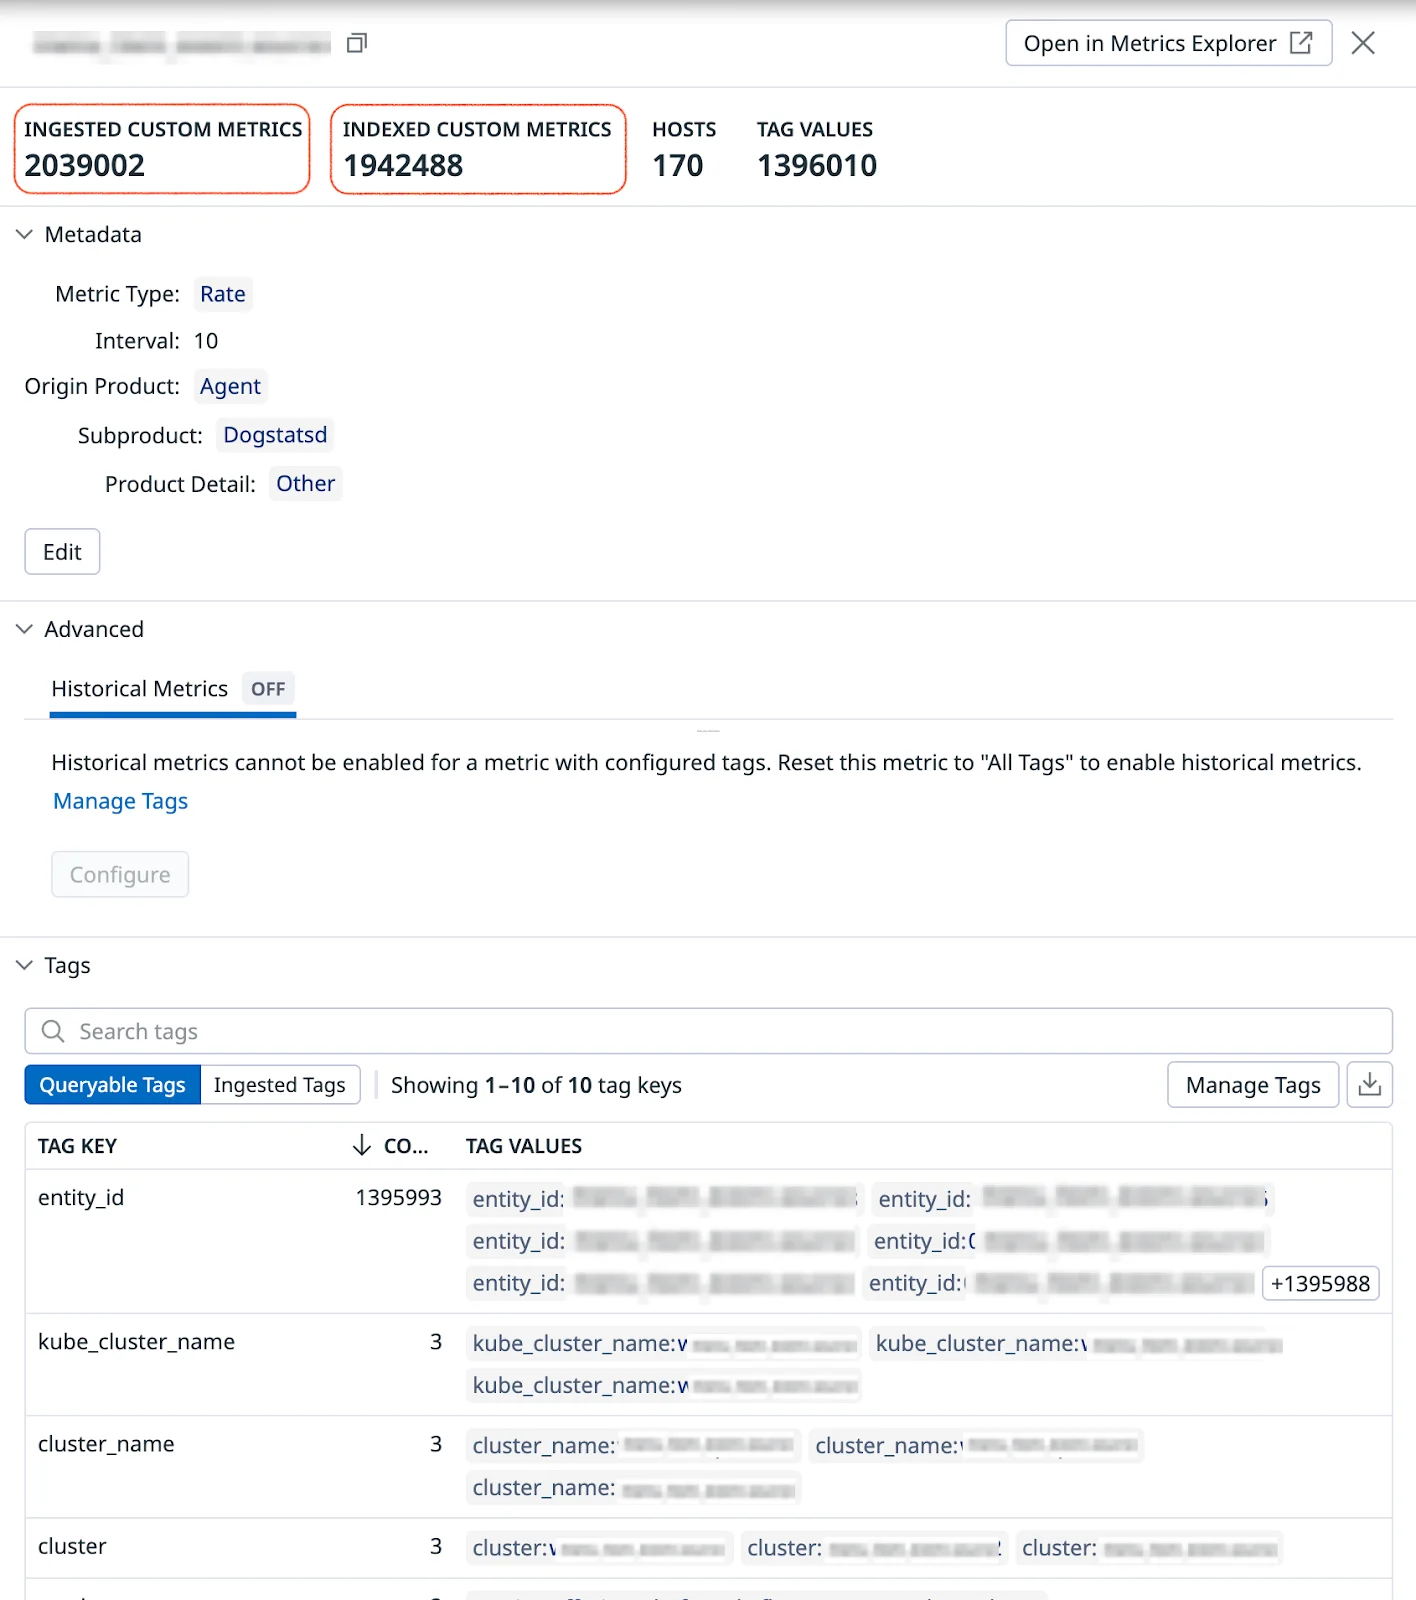
At small scales, this isn’t an issue. But in a large, dynamic environment like Wolt’s, where hundreds of microservices emit telemetry, uncontrolled cardinality can overwhelm observability systems, increase query latency, and drive costs up exponentially. For instance, we discovered a single metric that exploded into nearly 2 million unique time series. Each of these was treated as a separate custom metric by Datadog, significantly increasing our telemetry volume, and our costs, even though most of them weren’t providing meaningful insight. The culprit? An entity_id tag being submitted inadvertently, combined with three different Kubernetes cluster tags, all carrying identical values. This was merely one of several such cases we encountered.
Metric cardinality is one of the most important and often underestimated aspects of operating observability systems at scale. And it quickly became clear that we needed to actively manage and contain it before it spiralled out of control.

Towards Sustainable Observability at Scale
Phase 1: Cleanup & Quick Wins
Our first priority was to understand why our cardinality was surging compared to our initial estimates before migration, and we quickly found a major contributor: Datadog’s AWS integration.
By default, when an account has AWS integration enabled to bring in CloudWatch metrics, it also automatically appends all AWS tags associated with EC2 nodes as dedicated tags to every metric.
In our environment, this meant Datadog was injecting dozens of AWS metadata tags into every metric including custom metrics:
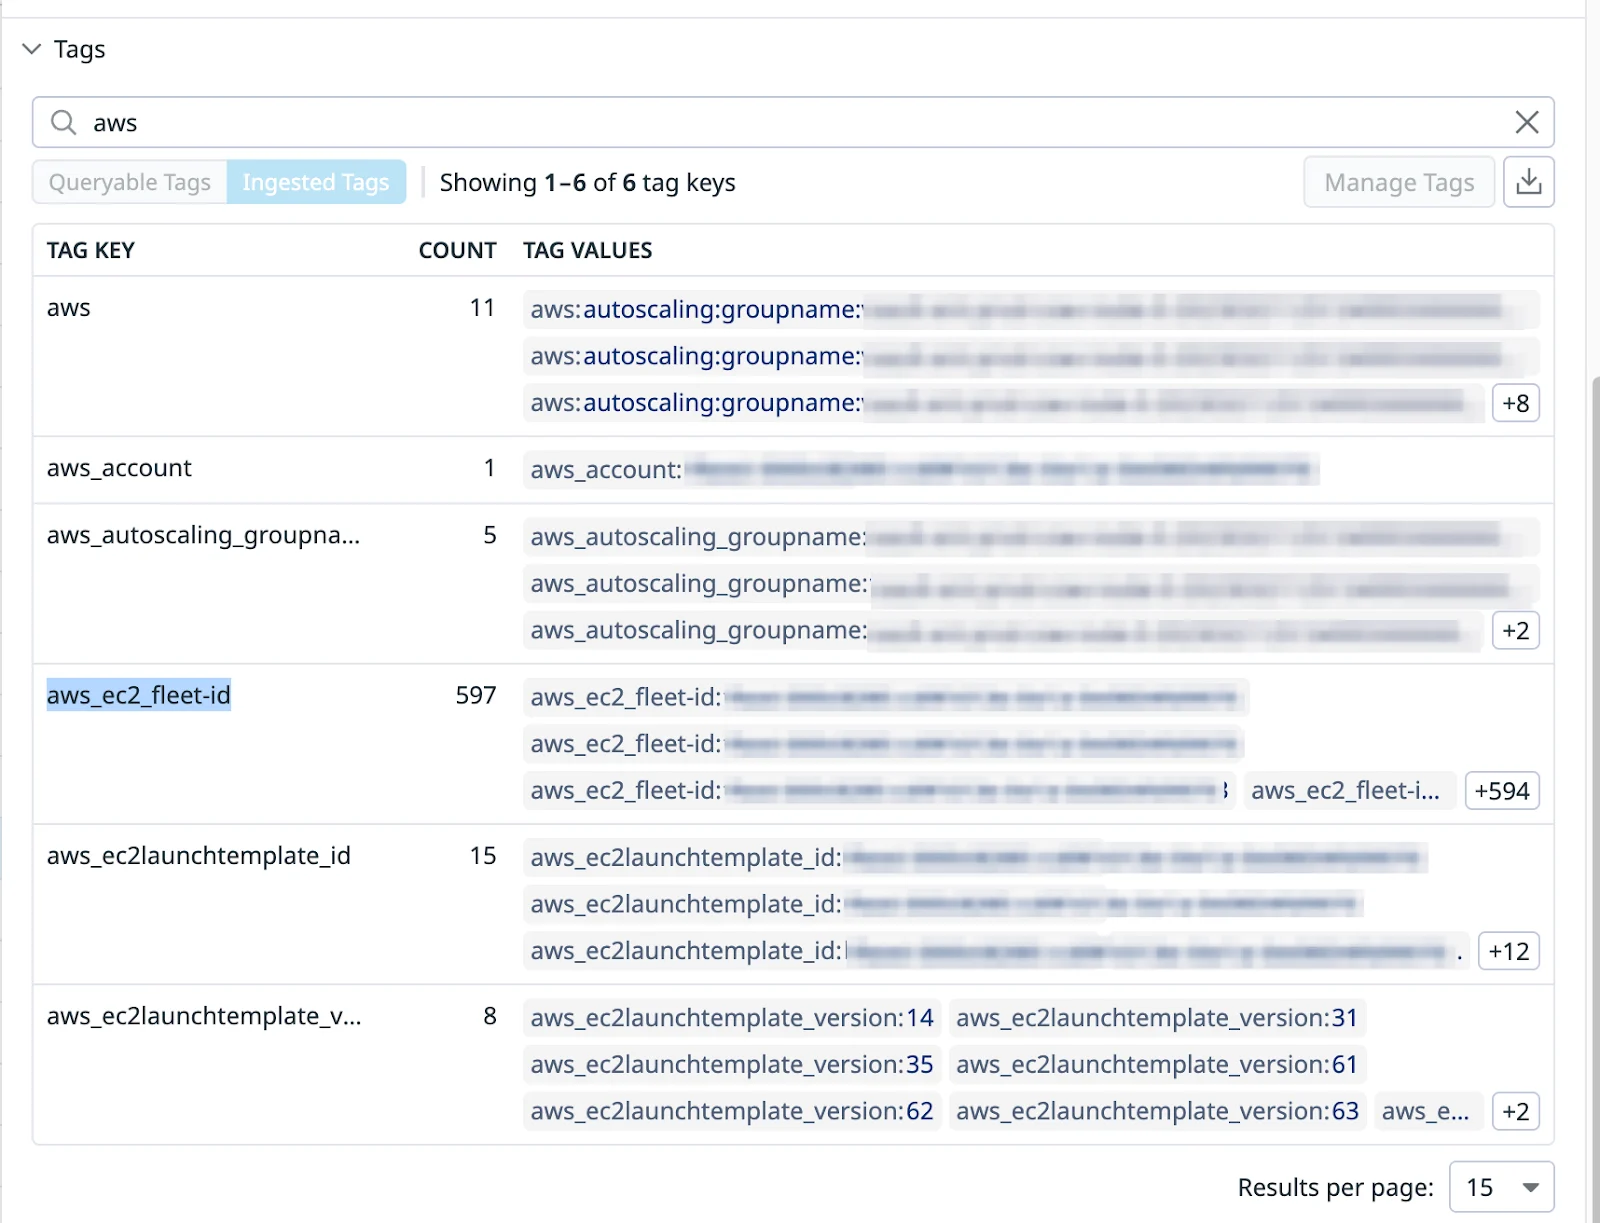
For a platform like ours, Kubernetes-native, multi-AZ deployments, and dynamic EC2 node groups, this behavior acted as an unintentional cardinality multiplier as these tags were not particularly useful except for e.g. availability-zone or region tag, which were anyway available on our Kubernetes system metrics. When these AWS tags combined with app-level tags like container_id, uuids, user_ids, urls etc., they caused metrics cardinality to explode into tens of thousands of unique series.
What made it worse:
We weren’t using AWS metrics in DataDog. CloudWatch’s latency made them unsuitable for our SLOs.
None of these tags were referenced in dashboards, alerts, or monitors, yet they accounted for ~40% of our total custom metric volume.
These AWS tags were not part of our original metric ingestion, yet they were being silently appended, exponentially increasing cardinality.
Disabling the AWS integration stopped new tags from being added, but didn’t solve the problem fully. Datadog caches these tags internally within its metric store, and removing them requires forcibly purging this cache. The process was undocumented and far from trivial.
Eventually, we found a workaround with a utility script provided by Datadog which allowed us to flush out the cached metadata. Once we ran it, we saw a 40% drop in active time series volume, our first major win in controlling metric telemetry bloat.
Phase 2: Proactive Guardrails – Enter TRIM
Disabling integrations and flushing caches gave us an immediate win, but observability across Wolt’s large and growing ecosystem — hundreds of services with new ones added each year, and external QPS increasing by over 70% annually — required a more deliberate approach, one that embedded hygiene into the system by design.
We needed to actively manage and control cardinality at the source, especially to prevent bloat creeping back in through tags introduced by our own applications. That’s when we built TRIM (Telemetry Resource Ingestion Manager), a lightweight policy engine designed to:
Provide baseline guardrails for telemetry ingestion to prevent runaway cardinality
Give teams visibility into their observability footprint and surface inefficiencies
Enable reporting and traceability to support data-driven decision making
While TRIM was designed to support broad future use cases like log field hygiene, trace attribute pruning, and retention strategies, the initial focus was on metrics.
Here’s how it works:
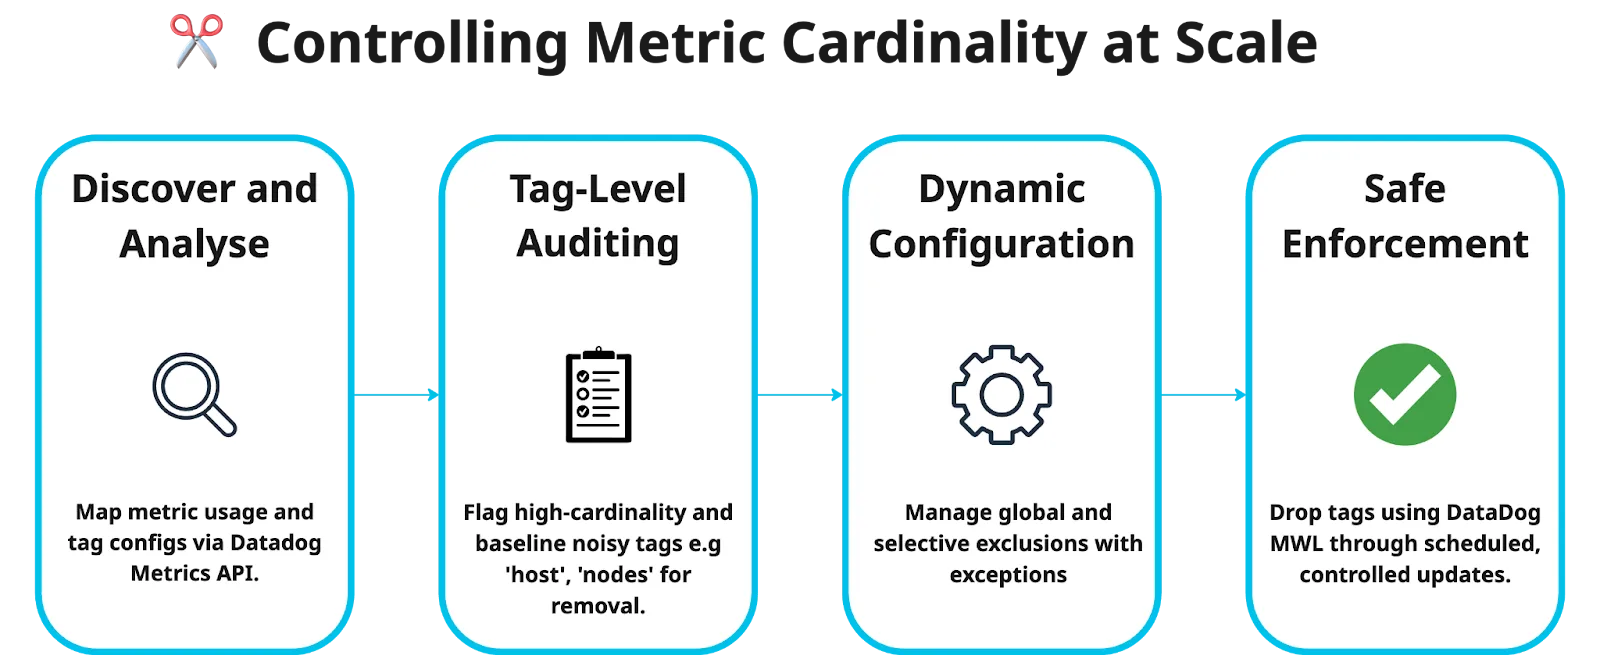
TRIM uses the Datadog Metrics API to analyze metric usage and audit which tags are used where (dashboards, monitors, SLOs).
If a tag is high in cardinality but not actively used, TRIM flags it (e.g. entity_id, user_id, and route)
TRIM also enforces baseline guardrails by excluding known noisy tags (host, kube_node), which are globally available and targeted for removal by design.
Importantly, TRIM is non-intrusive:
It avoids automatic action on metrics or tags used in dashboards, alerts, or SLOs—even if high in cardinality—and flags them for manual review.
Teams can request exceptions or temporarily re-enable tags during incidents.
Exclusion rules are maintained in a centralized, dynamic configuration supporting both global and selective policies.
All actions are logged for traceability. This audit trail provides visibility and safeguards critical observability use cases.
By baking observability hygiene into our platform, TRIM helps us scale intentionally, ensuring that telemetry remains useful, manageable, and cost-effective. TRIM follows a streamlined process: intelligent analysis, tag-level auditing, dynamic configuration, and safe enforcement.
Impact: Measuring the results
Since our first round of optimization in Q4 2024, metric volumes had already climbed back to pre-optimization levels within six months, even without the AWS tags issue. This was fueled by natural growth, the addition of new services, and, inevitably, increased telemetry waste creeping back into the system.
By Q2 2025, the situation had become particularly challenging. Fortunately, this coincided with the rollout of TRIM, enabling us to tackle these inefficiencies proactively.
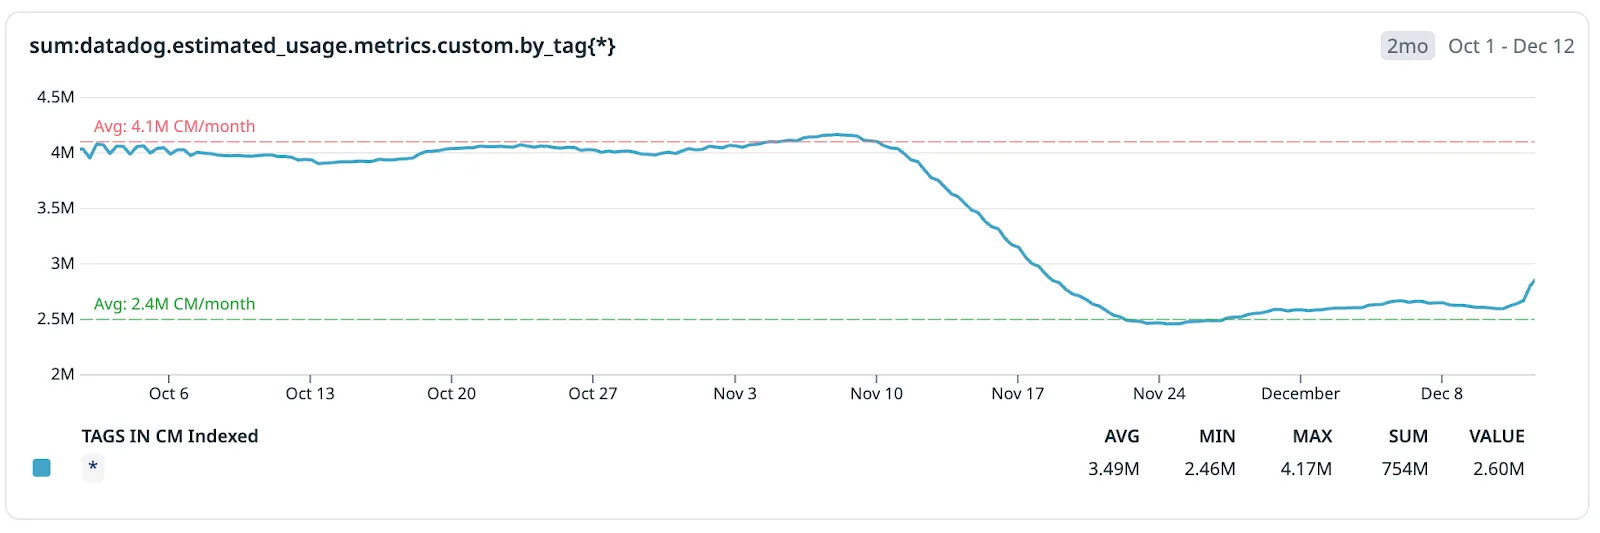
The results were almost immediate. Within weeks of TRIM’s deployment:
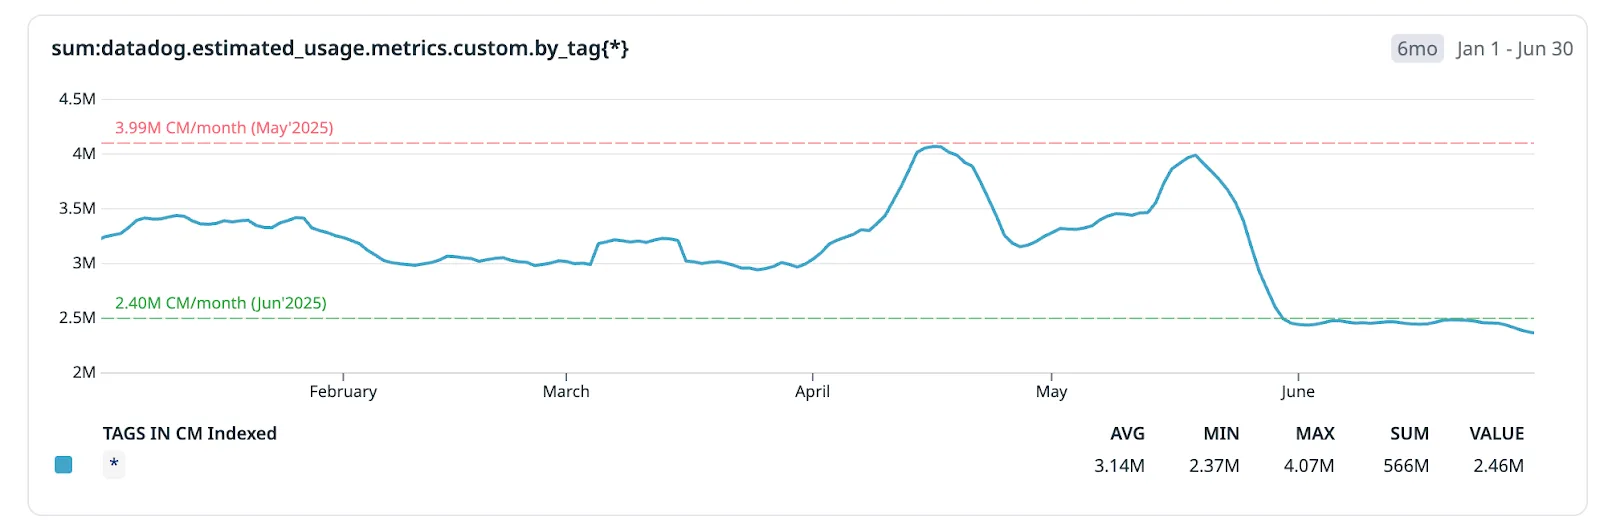
Custom metrics volume (indexed) dropped by 39%, from 3.99M to 2.47M time series.
Metrics usage and costs became more sustainable and predictable
Teams gained visibility into their telemetry footprint, shifting from “emit everything” to “measure with intent”
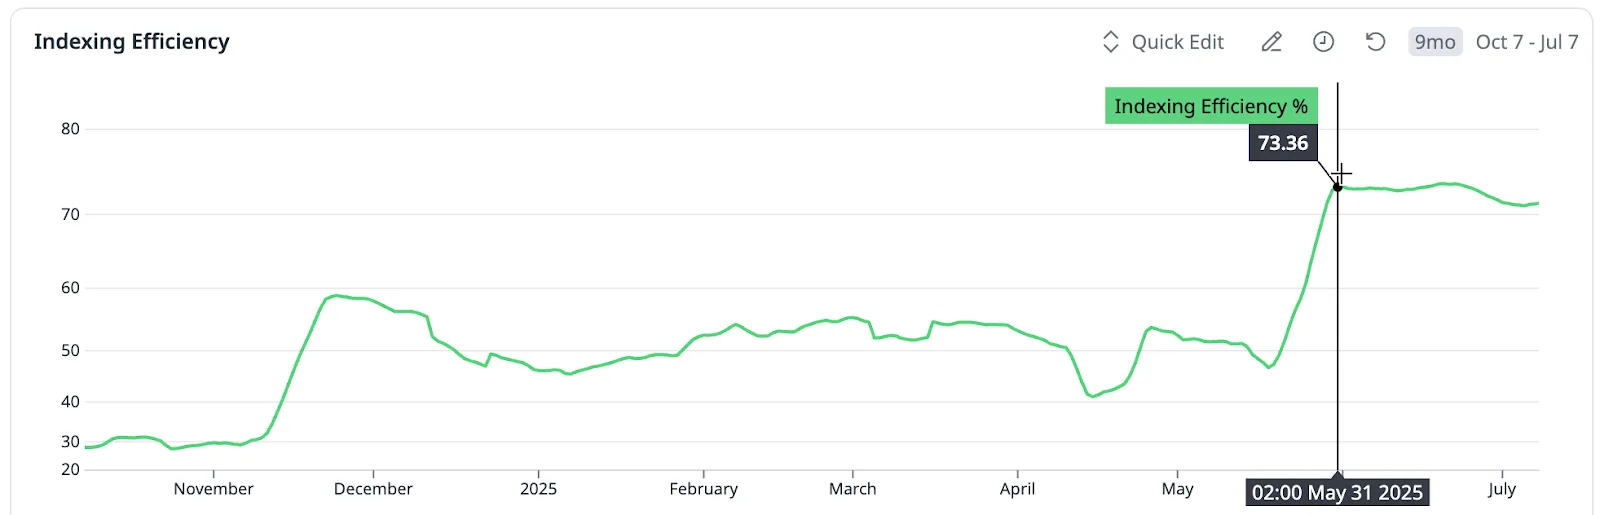
To better measure impact, we introduced a new KPI: Indexing Efficiency. This metric reflects how effectively we minimize the number of custom metrics that are ingested but never queried or indexed.
In simpler terms:
✅ High efficiency means we’re indexing only the most valuable metrics, keeping costs under control
❌ Low efficiency means we’re indexing too many metrics, including noisy or redundant ones, driving unnecessary costs
Formula:
Indexing Efficiency = 100 − ((Indexed Custom Metrics ÷ Ingested Custom Metrics) × 100)
This KPI became a cornerstone of how we monitor and communicate the health of our metrics pipeline. After TRIM’s rollout, our indexing efficiency jumped from 49% to 73%, meaning that out of ~9.15M ingested custom metrics, we were now retaining only 2.47M (about 27%) in Datadog’s metric store. By improving indexing efficiency, we ensured that only high-value metrics were retained, reducing noise and keeping telemetry growth sustainable.
But efficiency isn’t just a technical win, it also translates to meaningful cost savings. Using DataDog public list pricing ($5 per 100 custom metrics/month), the table below presents the potential impact without TRIM intervention.
Scenario | Metric Volume | Estimated Monthly Cost (List Price) |
Without TRIM | 9.15M metrics | ~$457,500 USD |
With TRIM | 2.47M metrics | ~$123,500 USD |
📝 Note: These figures are illustrative (based on Datadog’s public pricing) and do not reflect Wolt’s actual costs or savings.
What’s next: Building the Future of Observability
Our broader vision for TRIM is to extend its capabilities across all telemetry signals–logs, traces, and beyond. This aligns with a foundational architectural shift we’re driving: adopting OpenTelemetry (OTel) at scale.
With OTel, we aim to solve many telemetry challenges as close to the source as possible, standardizing data collection, reducing vendor lock-in, and enabling cleaner, more flexible pipelines. TRIM will evolve into a strategic layer in this new world, acting as a policy engine for governance and hygiene in the observability pipeline.
Here’s how we see it shaping up:
At the processor stage: TRIM acts as a rule engine powering telemetry hygiene, filtering, normalizing, and applying quotas before data is stored.
Integrated with developer tooling: Insights from TRIM will feed directly into internal platforms, giving service owners real-time visibility into their telemetry footprint.
With OpenTelemetry for scalable, standardized collection; and TRIM as a centralized policy engine, this combination sets a clear path toward sustainable and developer-friendly observability at Wolt’s scale.
As our systems and teams grow, this architecture will help us maintain agility and control, ensuring every byte of telemetry is intentional, actionable, and cost-efficient.
Closing thoughts
More telemetry doesn’t automatically lead to better observability. At scale, it often leads to the opposite: more noise, higher costs, and slower insights. The real challenge isn’t collecting all the possible data, it’s collecting the right data.
What we’ve learned at Wolt is that purposeful telemetry, the kind that’s clean, intentional, and governed, is what truly empowers teams. It helps engineers debug faster, operate more confidently, and build systems that scale without waste.
As we continue to evolve our observability architecture with tools like TRIM and OpenTelemetry, our north star remains the same: helping every team own their services with clarity and confidence.


