Tech
Chi Toan
Sep 14, 2022
Datadog region migration at Wolt
Since 2017, Wolt has paid a lot of attention to observability, as we believe it’s the foundation of reliability. In 2021, we established our performance and observability team with the mission of enabling our engineers to quickly diagnose and fix issues when they arise. Our engineers come from multiple backgrounds and work on different domains, as they focus on a variety of areas like our platform, mobile, payments, logistics, consumer and much more. Nevertheless, they have the same passion for bringing the best reliability practices to their services. To achieve that goal, we need to build a scalable ecosystem with a huge integration between a toolset of multi-platforms such as Prometheus, Grafana, Sentry, and Elastic.
One of the integrations we’ve worked on recently is Datadog. We adopted Datadog to get a better understanding of our system journey and set up our account when Datadog was only run in the US. In the past few months, our observability team has taken the task of migrating all the real-time events from Datadog in the US Region to the EU Region.
In this blog post, we’ll share about our Datadog region migration — from why and how we did it, to reflecting on and sharing our learnings from this process. While it’s a way for us to reflect on the process as a team, hopefully sharing about the obstacles and benefits can help you if you’re working on a similar migration process.
Why was it important for us to do region switching?
At Wolt, we always aim to optimize the efficiency of the tools and systems we use. Datadog provided us with a convenient way to gather and correlate events arriving into our data pipeline. We set up our Datadog account four years ago. Back then, Datadog had not launched in the EU region yet, thus we chose the US region even though our headquarters are located in Helsinki, Finland.
In the first quarter of 2022, our team decided to switch the current Datadog region from the US to the EU. Another factor is that about 90% of our ecosystem now is located in the EU area thus using the Datadog EU region for sending the data events would be more reliable. This way the roundtrip time would be largely optimized for hundreds of millions of data events every day. We also wanted to control the data compliance better, and have a deeper understanding of what we’re sending and storing on the different platforms. Talking about data compliance, we’d want to emphasize that Datadog is used to track the health and performance status of Wolt’s internal services and it doesn’t transfer any personal data, for example collected from our customers or partners.
So let’s take a look at this migration process!
How we use Datadog at Wolt
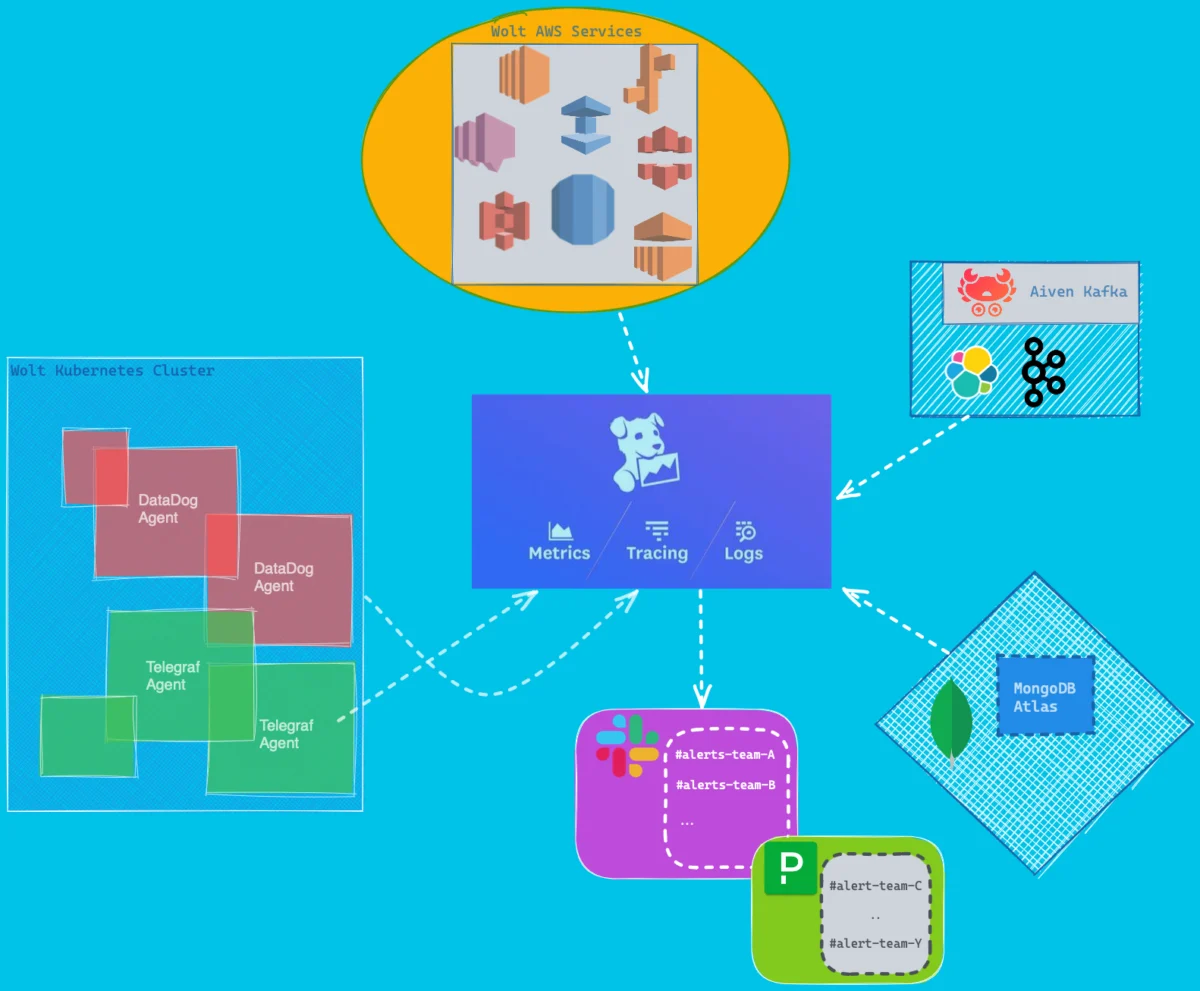
It’s not easy to answer this question without going through our Datadog responsibility diagram:
In general, Datadog at Wolt is mainly used for application performance monitoring (tracing) and events from third-party services, as we believe the behavior between application-to-application is very important for understanding the operation of our systems.
The goal of using Datadog is to deliver a unified observability pipeline that helps us bring the best correlation across the environments, so developers can take full advantage of a global view with features like dashboards, alerting, SLO (Service Level Objective) calculations and more. Therefore from 2019 we’ve adopted quite a few Datadog components for various needs.
Planning and evaluating our Datadog migration
Our performance and observability team treats other engineers as internal customers. So we evaluate and discuss any challenges and concerns together before making decisions.
Before the implementation, we set together three main requirements for the migration:
During the migration, all the data must be sent constantly without interruption to the current region.
All the resources like dashboards and monitors must be consistent between the two regions.
All the integration with other third-party applications must be migrated with the same configuration quality as before.
To adapt to those demands, our team tried to evaluate the technical solution with some explicit questions as there are two parts to migrate:
Static resources types, such as dashboards, monitors, and SLOs. They were already provisioned on the US side, so what would be the best way to copy those resources to the EU side without making any mistakes?
Dynamic resource types, such as metrics and trace events which are collected by Telegraf Agent, Datadog Agent, and third-party integrations (for instance AWS or Aiven). How should we configure the dual shipping for each of the components?
With these two questions, our team tried to evaluate several different solutions. For the first one, we combined the two popular solutions that had been written by the Datadog team DogMover and Datadog sync CLI.
The second question was trickier. We saw that Telegraf and Datadog Agent might support a dual shipping feature, however all of the third-party applications might not have that feature.
In terms of collaboration and internal communication, it was also important to raise awareness about this project to our entire engineering team, so we did lots of internal communication and documentation around it. Our RFC (Request for Comments) culture brought a huge benefit for all the teams involved in the migration process. We also found value in things like Slack message scheduler and Google calendar reminders to provide updates on the migration process.

How we implemented the Datadog migration
As the diagram above explained, we have a number of different sources which send events to Datadog.
For Telegraf, we used the traditional Datadog plugin that helped us flush events to the two particular Datadog API endpoints. A few tuning for the Telegraf buffer-size, batch-size, flush-interval to ensure the data flow was delivered instantly, even though the trade-off here is memory resource consumption.
For Datadog-Agent, the heart of our collector layer was applied with a dual shipping feature as mentioned above. Regarding the Datadog documentation, it’s worth noting that each feature can be configured either via the environment variable or configuration file. There’s no need to configure them both. It was rather difficult to find a proper endpoint (an additional endpoint) for the EU side for particular services (APM, process, database monitoring, metrics). Below is the list that we gathered based on the traffic inspection during the evaluation time:
Environment variable per services | Endpoint |
APM_PROFILING_ADDITIONAL_ENDPOINTS | https://trace.agent.datadoghq.eu |
APM_ADDITIONAL_ENDPOINTS | https://trace.agent.datadoghq.eu |
PROCESS_ADDITIONAL_ENDPOINTS | https://process.datadoghq.eu |
ORCHESTRATOR_EXPLORER_ADDITIONAL_ENDPOINTS | https://orchestrator.datadoghq.eu |
DD_ADDITIONAL_ENDPOINTS | https://api.datadoghq.eu |
Datadog environment variables for the additional endpoints per service.
3. Unlike the Datadog or Telegraf agent, the integration part required several changes in different places. Luckily, all of those are managed under Terraform. For example, the Datadog and AWS Integration required changes for IAM roles. Similarly, for Datadog Slack Integration we used Datadog Integration Resource by Terraform to import more than 20 channels that were being used in the US and provision them in the EU.
We faced some difficulties with migrating resources related to Aiven, especially Kafka which is the backbone of our data-driven platform. We use Aiven Kafka as an inter-communication hub for hundreds of internal services. Needless to say, the Kafka related metrics are crucial and couldn’t be dropped even for a short while. Unfortunately, the Datadog integration feature from Aiven Kafka only allows sending to one region at a time. If you try to add an additional Datadog region, you’ll get an error: “Only one integration of this type allowed per service”.
The principle of resilience that our group tries to improve every day allows having more than a single solution on the table. For example with Datadog Aiven integration, the dual shipping feature is kind of a nice to have feature, so we didn’t request it immediately from the Aiven tech team. Instead we added the Prometheus integration into those instances. After that, the metric was sent to both Datadog (US) and our self-hosted Prometheus. With that help, during the short time, when we detached the Datadog US region and attached Datadog EU, our critical metrics were still sending normally to the Prometheus so we didn’t lose visibility at any moment 💪.
Challenges and how we overcame them
Our integration setup and configuration were formed rather sharply, but we got stuck with three main challenges during the migration with our team having tons of questions:
1. Data discrepancies between EU and US Datadogs
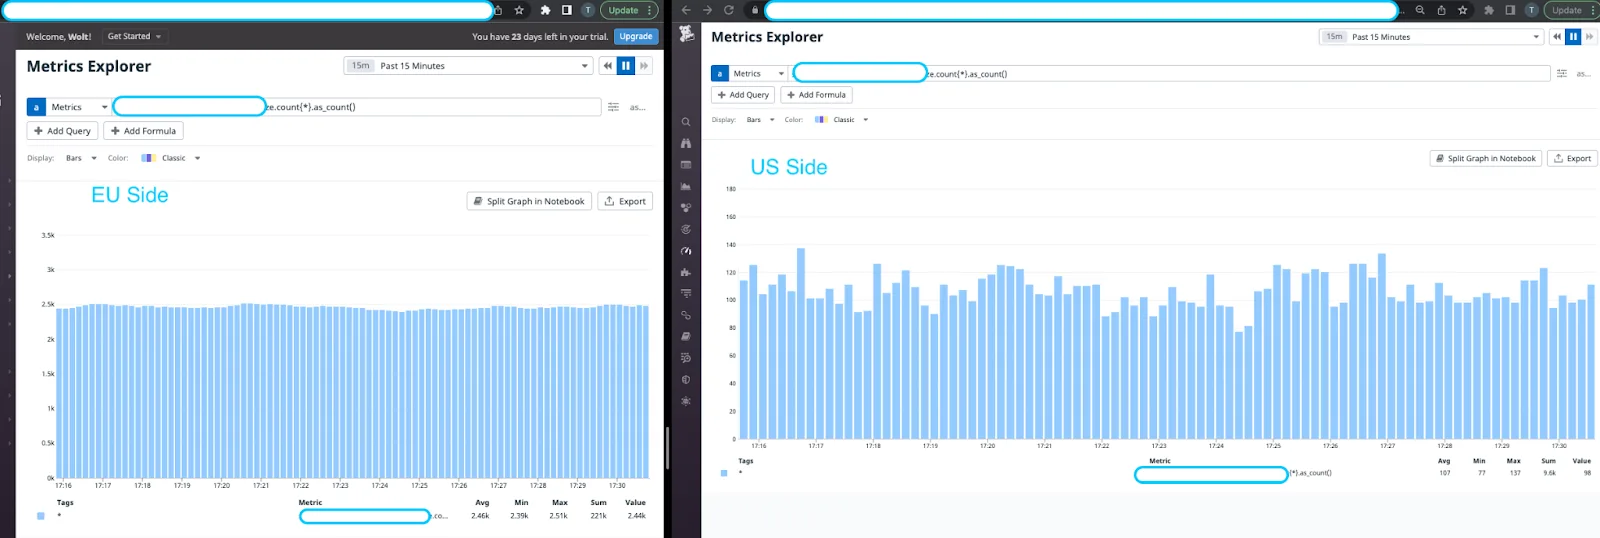
Our engineering team instantly spotted data discrepancies that were happening during the migration. In the graph below, we see the total number of a particular metric in the EU side is a lot higher compared with the US one. It made the entire team a bit frustrated because we couldn’t see any difference in the setup between the development and production environment. Why did it only happen in production? 🤔
We used the steps below to figure this out:
We immediately reviewed all our configurations and the agent adjustment just to make sure there’s no human mistakes during the manipulation time.
We outputted the raw metric before it was flushed to the Datadog endpoint to confirm the metrics weren’t compromised by any other factor during the collecting and transferring time.
It turned out to be the hardest result: There was nothing wrong from our side, so it must have been Datadog. And because we couldn’t examine anything behind the Datadog service, we couldn’t test our hypotheses to fully understand the issue.
One of our engineers asked whether we could look a bit deeper into that metric itself and figure out a potential reason.
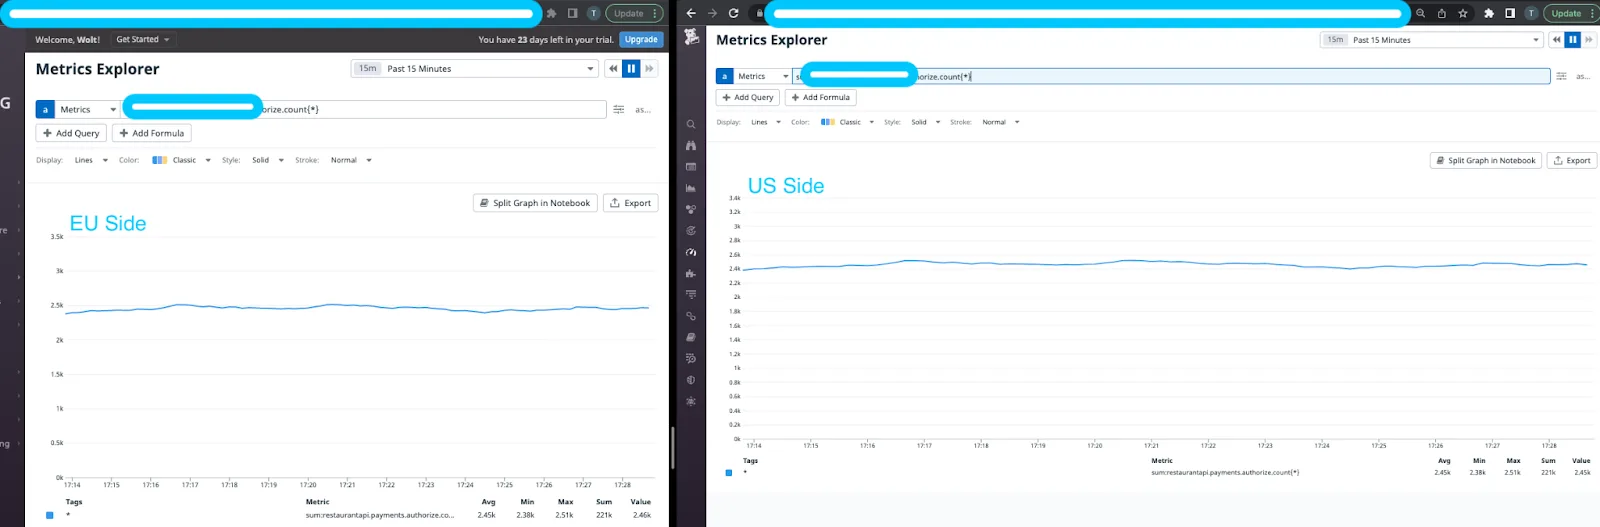
Indeed, the raw metric volume itself was pretty similar if we compared the EU and the US in a particular time frame. The discrepancy was only happening when we used the as_count function on the query.
It means this metric might be affected by another metric type attribution that we don’t know about yet. If so, the next question is: How do we know what’s the exact metric type assigned for my own metric?
Thanks to the Datadog support team and their reliable API, we were able to figure out the difference — that metric in the US was assigned to the count type, but in the EU it wasn’t. Using their provided API as listed here, we were able to adjust them and the discrepancy has been solved completely 🎉.
2. The Datadog alert shenanigans
As mentioned above, the DogMover is a tool for migrating the static resources, such as monitors and dashboards. However, we saw that hundreds of the alerts on the EU side were in a No Data state. It was unacceptable to move forward because it could have led our developer teams to a blind spot.
Based on the experience from the first issue, our team took a look at the metric itself. It seemed quite clear that the metric wasn’t present on the EU or the US side anymore. If so, why were all those monitors in the US showing an OK state? 🤔
After taking a closer look, we linked this behavior with a few things that happened in the past and organized a quick brainstorming session. Our developers also confirmed that the metric had had a data point in the past but now it was omitted due to several enhancements on their code base. It meant this monitor was initially created and a data point did arrive, basically putting the monitor into an OK state. Unexpectedly when we ran the migration, these latest monitors in the EU had never had any data arriving in the first place. So the team could never evaluate a group in the first place, and therefore this No Data state happened.
One of the key findings here was that the US monitors were never set to alert when a No Data state arrived. So these alerts stayed in this OK state forever, but in fact they had been skipping the evaluations for months.
We quickly raised the question to Datadog support and received the same confirmation. Our team decided to mitigate this issue by using the default_zero() function, and plan to append the alert when No Data for our monitors. In the end, 60% of the monitors were restructured and managed correctly with a flag toggle when the alerts have No Data. The rest were removed as they got replaced by better monitoring queries.
3. The changes in monitors and dashboards during the migration
Every day, our engineering teams keep looking at and improving their dashboards to have a better overview of our services’ health. During the migration, we encountered a high demand, not only for the dashboards, but also for other components such as monitors, and SLOs. As with all migrations, there were times when we were in a bit of an in-between state with the two environments. At a certain point, it wasn’t desirable for our teams to use the US Datadog side dashboards and monitors anymore, but also the EU environment wasn’t fully configured yet. This meant we had to find the right ways to guide our teams throughout the migration process, letting them know where we are in the process and what it means for the tools and components they use regularly at that given time. It was all about how to migrate things transparently while ensuring our teams can work as smooth as possible
Having said that, the DogMover did pretty cool stuff that helped us a lot for exporting and importing across the two regions. However, it was not enough for that specific demand. As the DogMover application itself didn’t have many choices for the filtering, especially for the monitors and dashboards, we combined it with the datadog-sync-cli to make the synchronization more robust.
Lastly, we have set up a CronJob for that application, running sequentially in a particular timeframe with a customized filter just to make sure of the specific static resources we wanted to copy.
Results: successful migration 🙌
We migrated more than 500 alerts and 160 dashboards across 20 teams. 20 integrations were adjusted to push the events into the Datadog EU. Our engineering teams are now using the new Datadog EU region as the main platform for their observations.

Some helpful tips to accelerate your migration process
To finish off, I’d like to share a few learnings for anyone who might be going through a similar Datadog region migration. This is what helped us:
Having an understanding of your events that are ingested to your Datadog account — clarify the need with your developer team to sanitize any resource they have
List down the integrations connected with your Datadog account. Do a quick check up on them before finalizing your migration plan.
Prepare a dashboard on both Datadog regions to make sure they receive an equal amount of data.
Have clear communication when you involve the Datadog support team. Like any other organization, Datadog engineers have their own priorities and standard questions to understand your problem. Try to capture the information as much as you can and give them a proper overview of the problem you are facing. Once the ticket is solved, don’t forget to give them helpful feedback on the collaboration.
Communication and consistent updates towards your team are key! There are many important areas that teams should be aware of from both regions of the migration; for example, login method, data retention, new and old integration, data shipping, stopping data point and alerting. Communicate with your key stakeholders as much as you can even if it feels like overcommunication at times.
I hope this blog post gave a nice overview of the work we’ve done migrating Datadog regions and, if you’re planning a similar migration, provided some helpful tips! Thanks to Ali Reza, Ibbad Hafeez, Zoltan Kincses, Mikko Peltola and all beloved developers who have participated in this great journey.