Engineering
Tero Laitinen
Nov 10, 2022
Optimizing SSR Memory Usage on wolt.com
Traffic to our consumer web app, wolt.com, has grown steadily, and over the years, we have taken gradual steps to increase server capacity and improve app performance. Provisioning enough resources to render and serve pages to legitimate users would have been straightforward. Unfortunately, like many other widely used services, our website has caught some undesired attention, too, in the form of scraping and denial-of-service attacks of growing size and complexity.
The website is server-side rendered to improve page loading speed and crawlability. Displaying the page quickly in the browser before the JavaScript code runs is essential for user experience. Server-side rendering (SSR) also helps search engines to crawl and index pages correctly.
Denial-of-service attacks manifest as sudden and massive increases in incoming traffic. These have caused our Node.js application to allocate more memory than available, causing the process to crash. We investigated the issue and found a simple way to curb Node.js’ maximum memory usage under high concurrency by employing HAProxy, a widely-used load balancer application, as a connection pool.
Trying to Serve All Requests Concurrently and Crashing
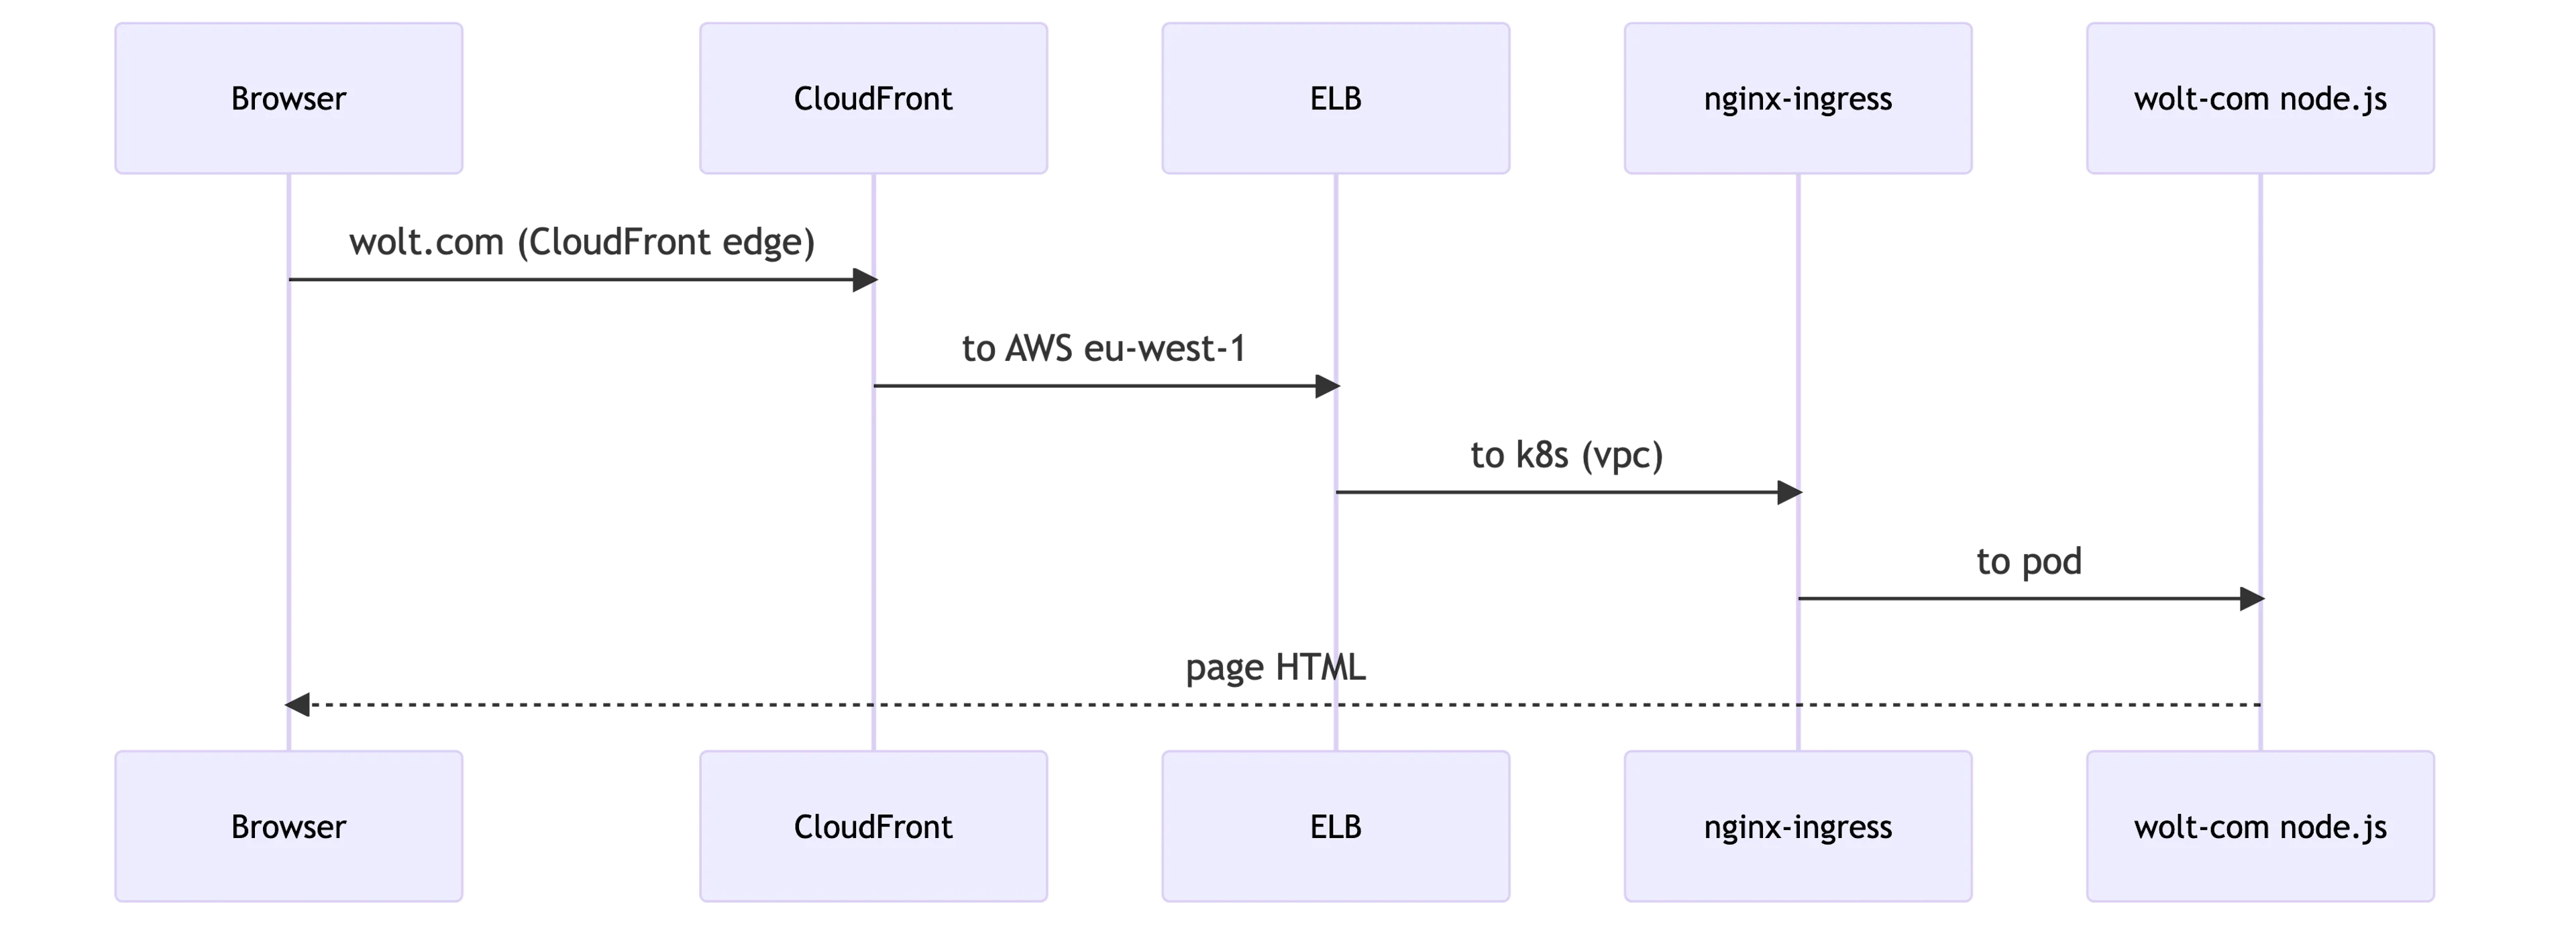
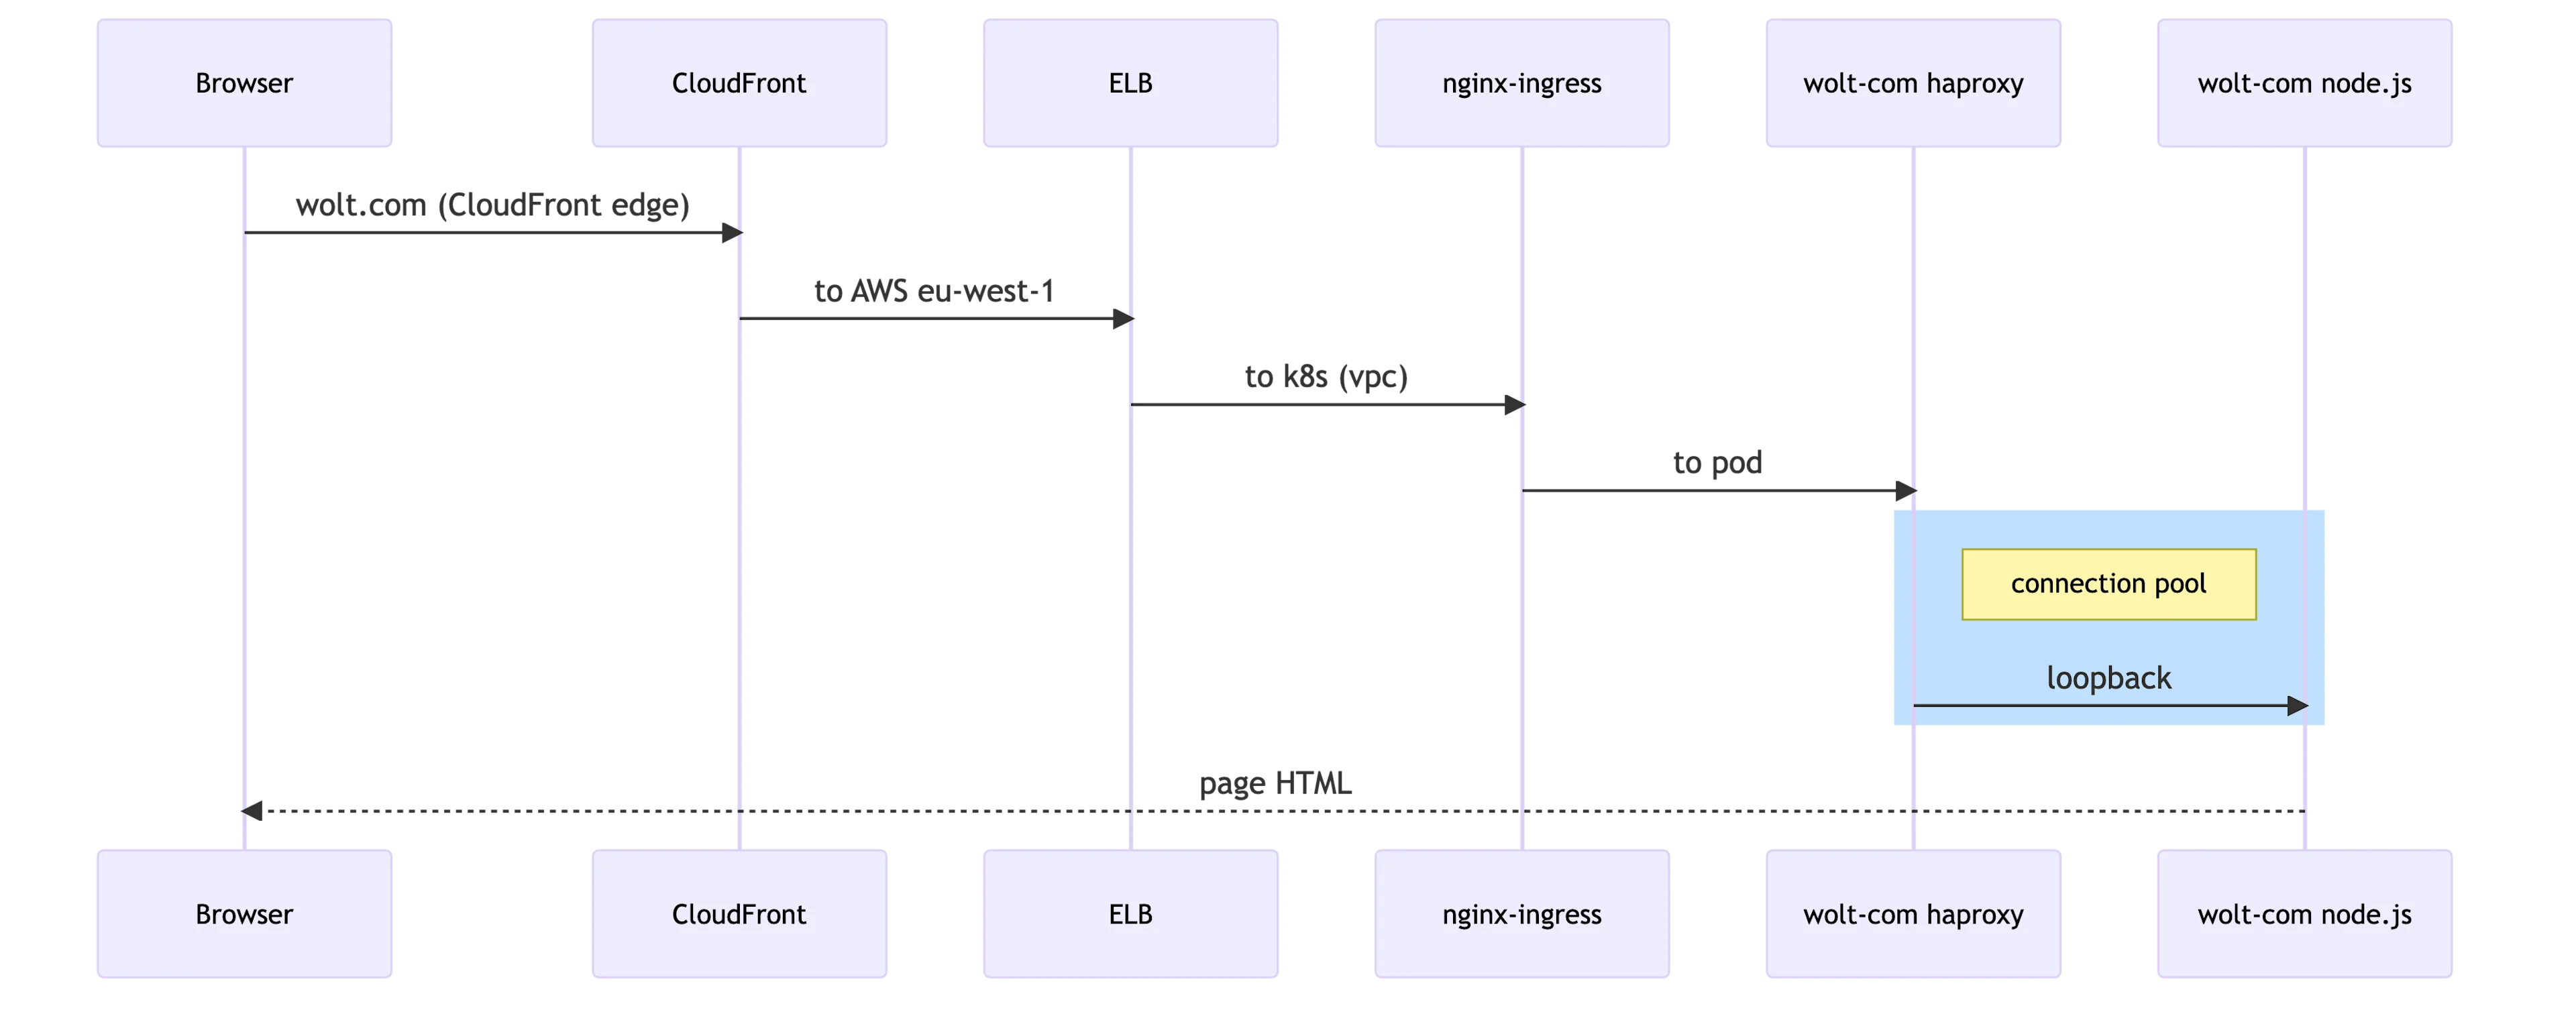
Once a browser sends an HTTP request to wolt.com, it travels to the closest CloudFront edge server. The CloudFront edge server connects to our Elastic Load Balancer in the AWS’s eu-west-1 region. The ELB forwards it to our Kubernetes cluster’s Ingress Nginx controllers, which again delivers it to wolt-com pods running our Node.js application. Under normal circumstances, the Node.js application returns a cached HTML page or renders a fresh one.
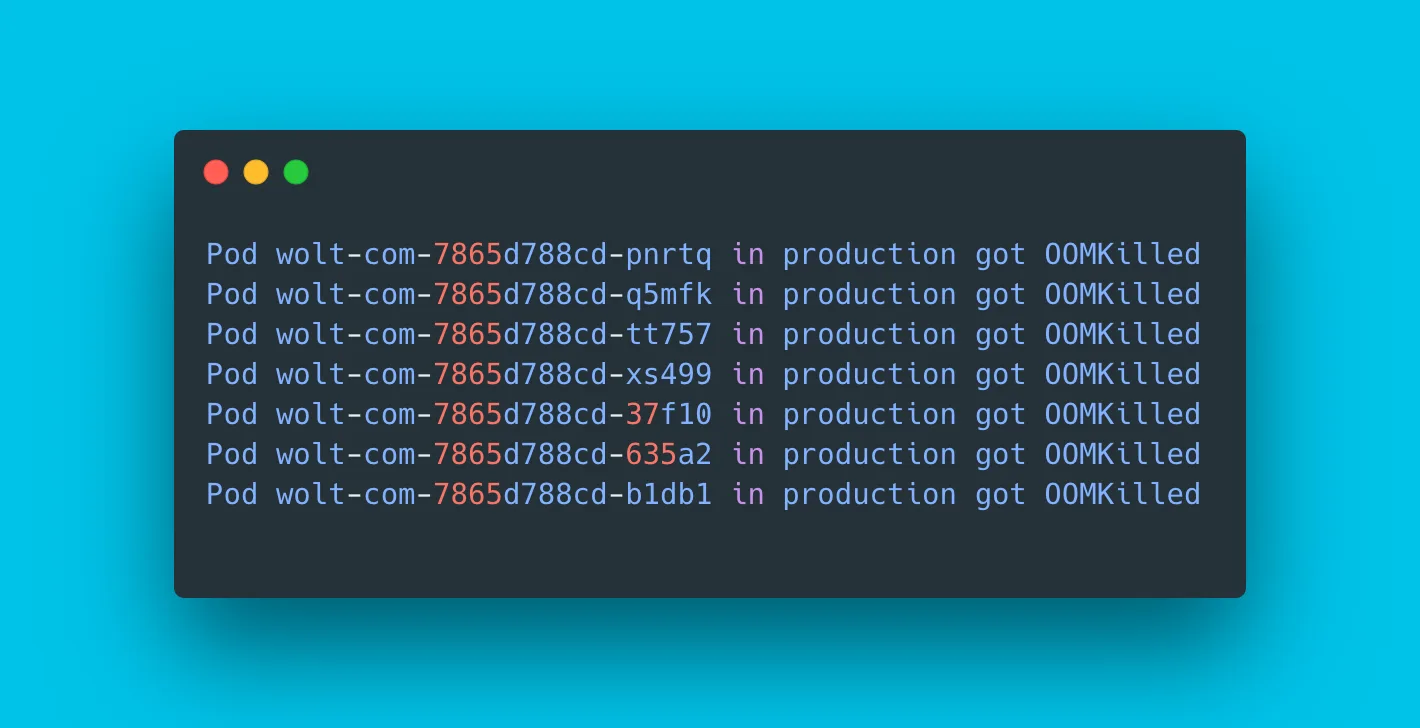
When wolt.com started attracting more denial-of-service attacks, our pods began to crash due to a lack of memory.
1 2 3 4Pod wolt-com-7865d788cd-pnrtq in production got OOMKilled Pod wolt-com-7865d788cd-q5mfk in production got OOMKilled Pod wolt-com-7865d788cd-tt757 in production got OOMKilled Pod wolt-com-7865d788cd-xs499 in production got OOMKilled
Looking at our Grafana dashboard, we noticed that the pods’ memory usage suddenly spiked tenfold. With such a rapid increase in incoming traffic combined with our conservative autoscaling rules, the Kubernetes autoscaler could not roll out more pods fast enough.
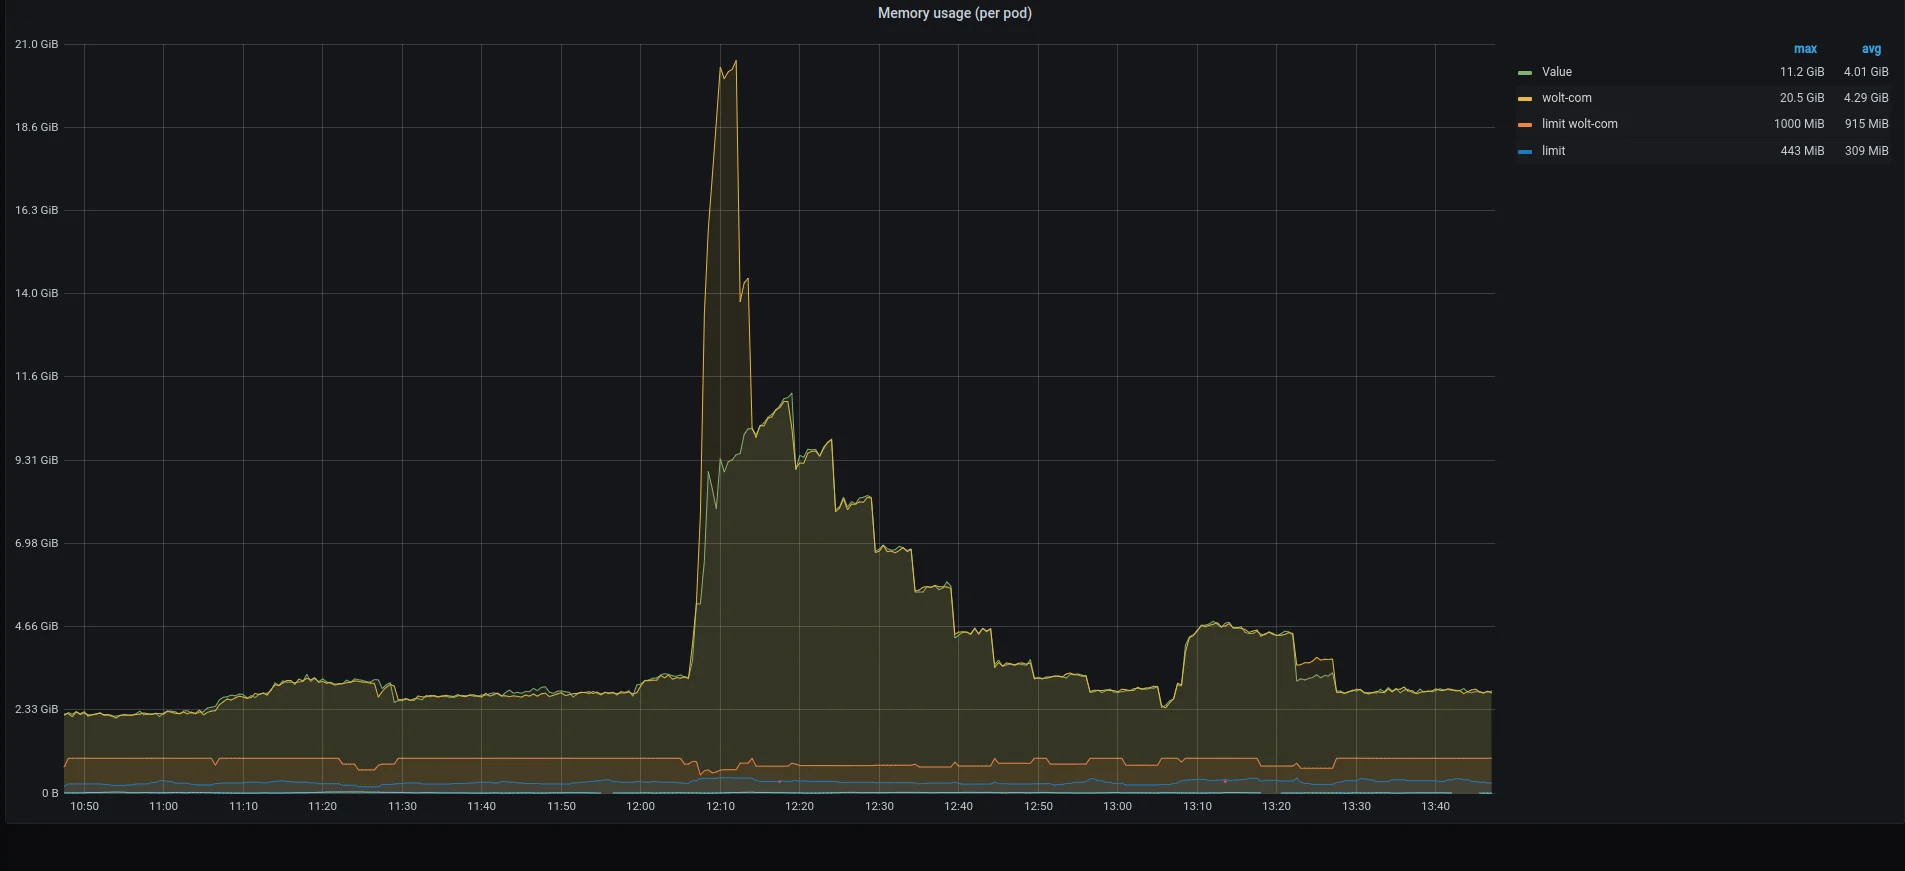
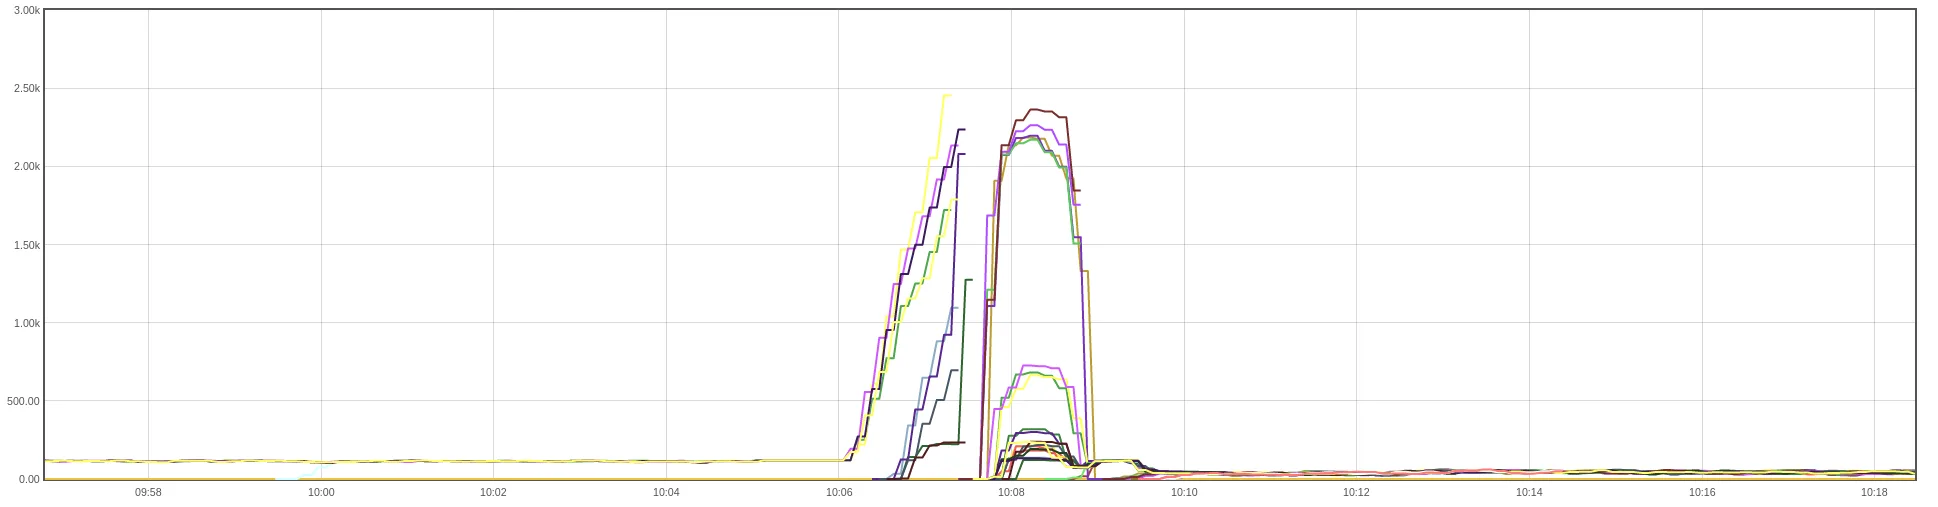
Typically, our Ingress Nginx controllers maintain approximately 80 active connections to a single `wolt-com` pod. During the denial-of-service attack, the number of concurrent connections handled by our Node.js app peaked at around 2500 connections before the app was OOM-killed.
Measuring Node.js Memory Usage
Many implementation details contribute to a server application’s overall peak memory usage. Our Node.js application allocates memory to receive incoming HTTP requests, render web pages using React, and hold page HTML buffers. We store cached page HTML entries in a Redis instance and a smaller in-memory cache. To keep the caching-related code simple and ensure that data structures associated with rendering can be quickly garbage-collected, we’ve used the synchronous ReactDOMServer.renderToString to render complete pages.
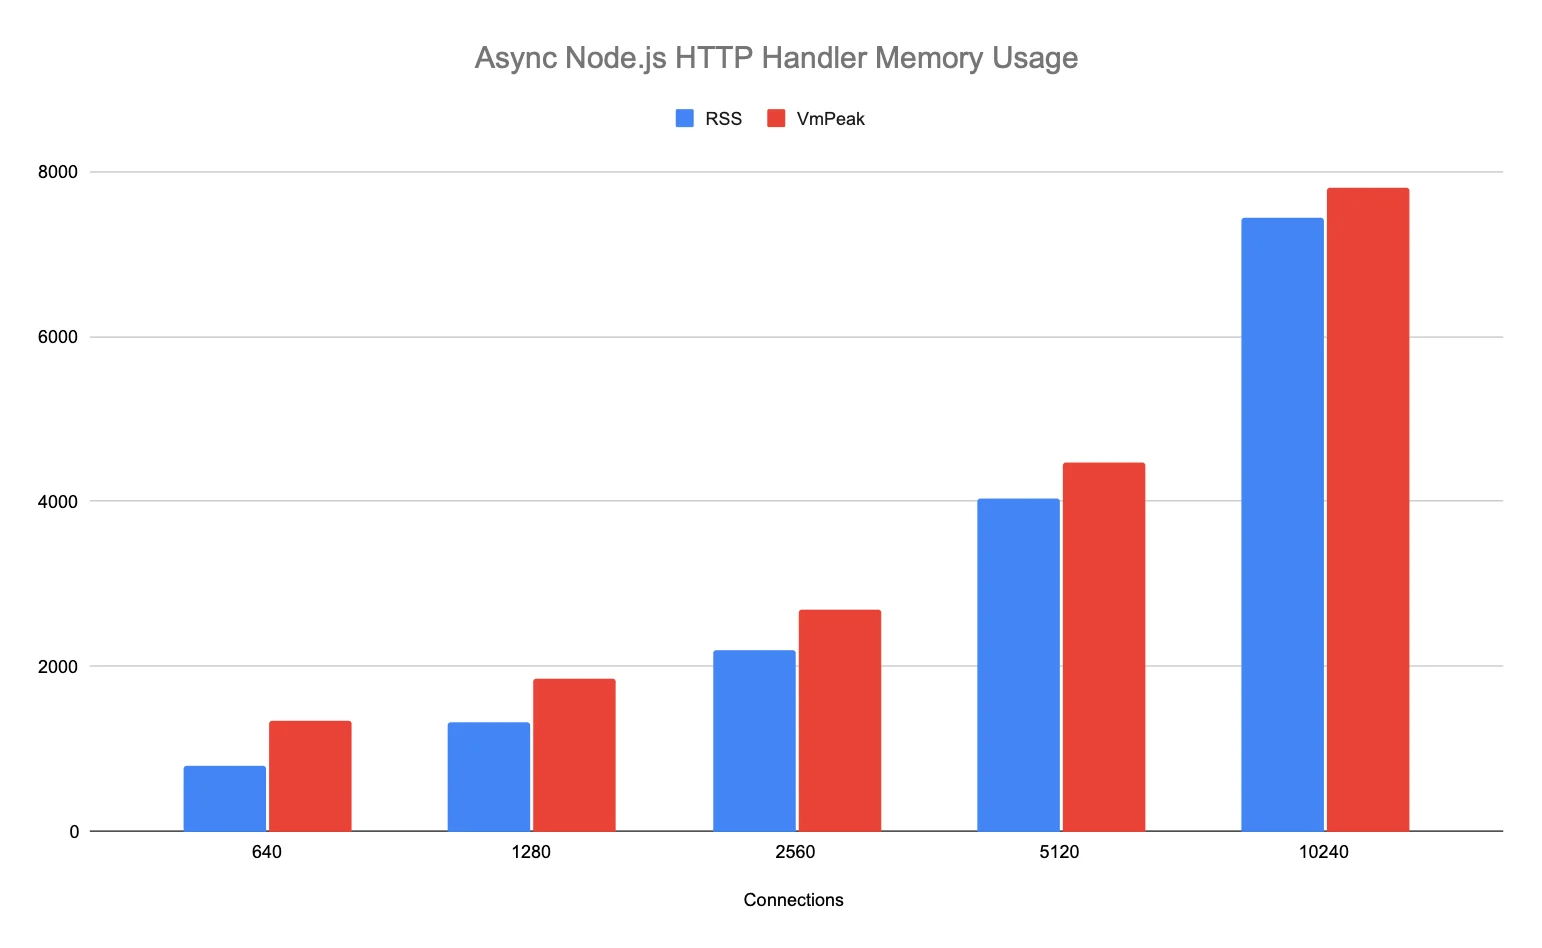
Irrespective of whether the app returns cached pages or renders them on-demand, the lack of streaming makes the page HTML buffers dictate the overall worst-case memory usage of the server application. The following simple Node.js server application, which replies with 1MB of “a” letters while measuring the peak resident set size, illustrates how the application’s memory usage can grow linearly with the number of concurrent requests.
1 2 3 4 5 6 7 8 9 10 11 12 13 14 15 16import http from 'http'; let maxRss = 0; const server = http.createServer((_req, res) => { const rss = process.memoryUsage.rss(); if (rss > maxRss) { console.log(maxRss / 1000000.0, 'MB'); maxRss = rss; } const buf = Buffer.from("a".repeat(1000000)) setTimeout(() => { res.writeHead(200); res.end(buf); }, 0); }); server.listen(3000);
The application allocates a buffer and responds to the HTTP requests asynchronously, allowing the event loop to drain fully until the garbage collector can reclaim the buffer. The peak memory consumption grows linearly with the number of concurrent requests.
Like the test application above, our Node.js server application manifested similar worst-case memory usage patterns. The wolt.com server application retained HTML buffers in the Redis client library code when it queued multiple Redis GET commands to retrieve cached pages.
Limiting Concurrency Decreases Throughput
In our case, the Node.js application allocates a sizable buffer when receiving a request and then queues a task in the event loop. Bounding the maximum number of concurrent connections to the application can help curb its peak memory usage. However, limiting how many HTTP requests the app can handle concurrently may decrease throughput if the server application requests data from upstream services. If an upstream request takes 100ms to finish, a Node.js server that processes only one HTTP request at a time can handle at most ten requests per second. By tweaking the setTimeout delay in the test application to 100ms, we can simulate how the latency caused by processing upstream requests, or other work, affects throughput.
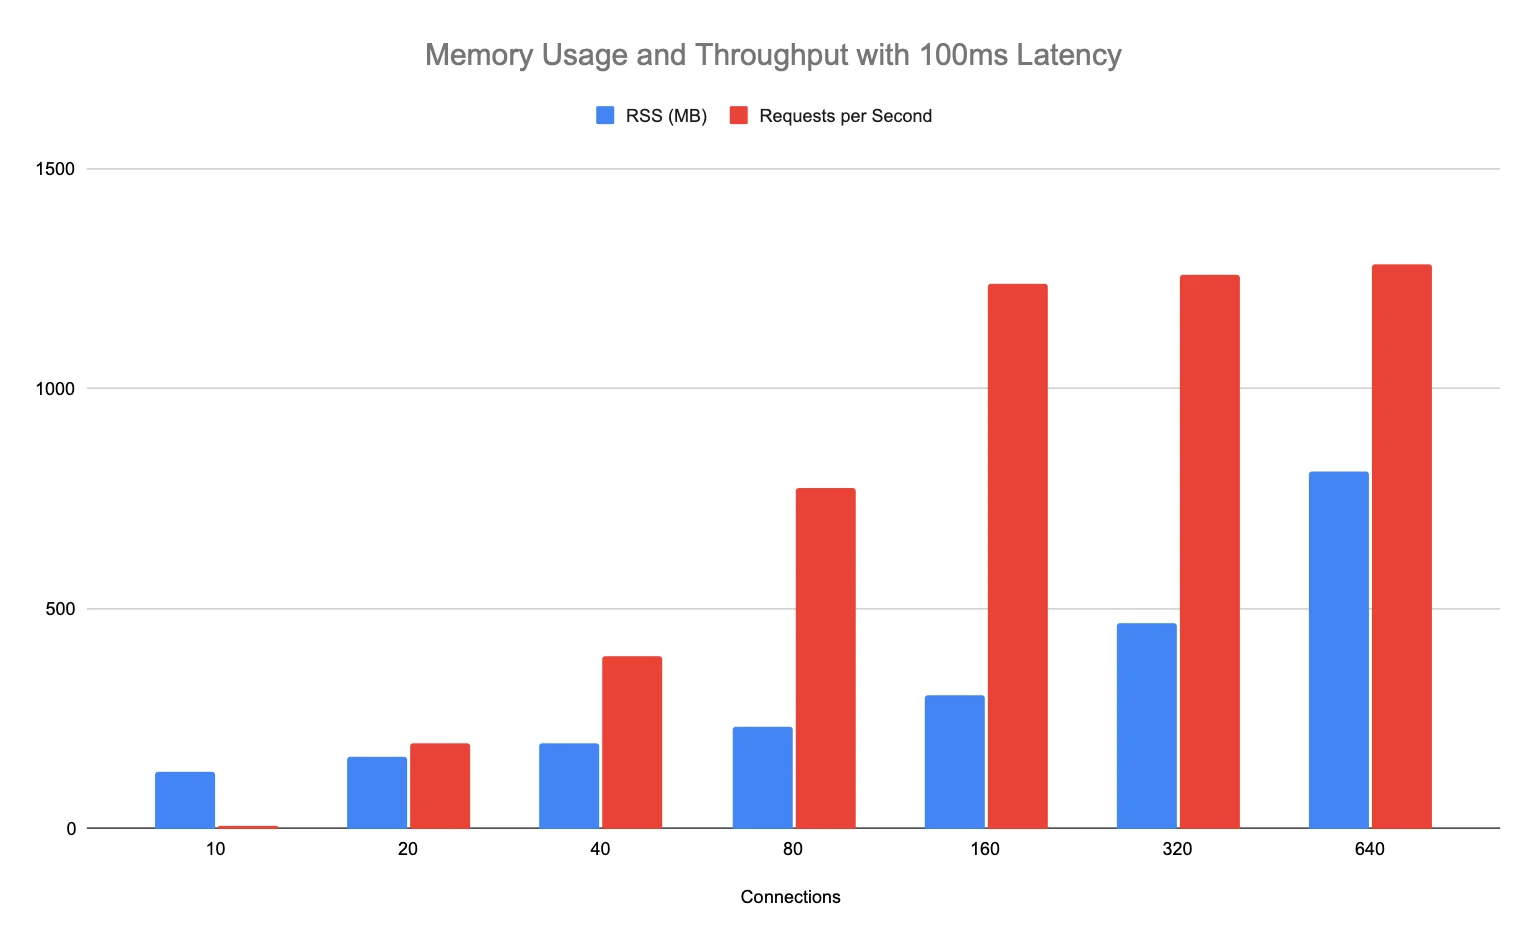
Memory usage and throughput grow linearly as the number of connections increases until the Node.js JS runtime saturates its CPU thread. More connections do little to boost throughput while memory usage steadily grows. By conducting load testing against our development cluster, we have measured the real-world performance of the wolt.com server application with different limits for the number of concurrent HTTP requests. These experiments have helped us establish the optimal concurrency setting for our Node.js application that yields a throughput close to the maximum without wasting memory.
Implementing Connection Pooling
Kubernetes’ Ingress Nginx controller would have been an ideal place to implement a connection pool for our Node.js application. However, when we were looking for a solution, Ingress Nginx did not include a straightforward way to limit the number of upstream connections. The only seemingly relevant configuration setting available at the time, upstream_keepalive_connections, controlled how many keepalive HTTP connections an Ingress Nginx controller maintains to upstream servers. Still, it could exceed this number under a high load.
The Node.js HTTP server does not offer a configuration option suitable for connection pooling. In principle, we could tweak our Node.js application to hold new connection objects in a queue and process a bounded number concurrently. Implementing connection pooling in our Node.js application, while possible, would have increased its complexity and could perhaps still allocate large request objects if incoming requests are suitably crafted.
An external connection pool is also attractive when considering Kubernetes’ liveness and healthiness probes. When a connection pool dams a surge of requests from, e.g., a denial-of-service attack, the Node.js application is not overwhelmed and can respond to Kubernetes’ probes that bypass the connection pool. We then settled for a simple solution and added HAProxy, a performant TCP/HTTP load balancer with a low memory footprint, to the container image. HAProxy can be configured to act as a connection pool with a short configuration snippet:
1 2 3 4 5 6 7 8 9 10 11 12frontend http_connection_pool mode http log global timeout client 30s bind *:3000 default_backend nodejs backend nodejs mode http timeout connect 5s timeout server 30s server s1 127.0.0.1:30000 maxconn 100
Running another process in the container and rerouting the traffic through a loopback connection costs additional CPU cycles and adds some memory pressure. Nevertheless, we considered it a workable solution due to its appealing simplicity and isolation, and it can be easily replaced with another approach if needed. Once we upgrade our Ingress Nginx controllers to use an Nginx version newer than 1.5.9, we can simplify the stack and set the max_conns configuration parameter.
Conclusions
Denial-of-service attacks and other sources of sudden bursts of HTTP requests can place heavy demands on the hosting infrastructure and software architecture. Minor attacks can often be mitigated by careful choices in critical points of the server stack and code. Yet, when faced with overwhelming incoming traffic, it’s crucial to fail gracefully. Ensuring the server application has predictable memory requirements under high load is necessary for gradual service degradation.
Adding HAProxy in the container between the Ingress Nginx controller and our Node.js application was a simple and effective way to ensure the pod’s memory usage stays within bounds while retaining most of its throughput.
As a result, our website is more resilient to sudden traffic spikes like denial-of-service attacks. We continue to monitor our increasingly challenging operating environment and analyze ways to mitigate different risks – hopefully before they realize.
Would you like to work on similar projects to this? We’re hiring for our Engineering team! Browse our open jobs 💙